One of the most pressing issues with our current society is that most nations have a birth rate which is below replacement. Replacement level is 2.1 children per couple which replaces the parents and allows for tragic accidents.There have been many causes suggested for this collapse of birth rates, and as this article is not meant as a thorough examination of all the proposed causes, it would behoove me to at least provide a gloss of the proposed reasons and why I do not believe they are the true culprits of the catastrophic decline in fertility rates.
The most often cited reason is that folks do not have enough money to have children. I would at some point in the future like to do a more thorough examination of this claim debunking it fully; however, for now, I will merely do a cursory glance at the hypothesis. This assertion is incorrect. For if this assertion was true, we would fully expect there to be a correlation between the GDP per capita and the fertility rates. As for other measures that some assert are superior to GDP, it should be noted that they correlate highly with GDP and, therefore, are not useful as additional metrics.
When testing this prediction, we find a correlation of -0.4661594 meaning that the correlation between GDP and fertility rate is moderate at best. We can anecdotally test this by pointing at nations such as Russia, Iran, and Brazil which are poorer and have a fertility rate of 1.8, 1.67, and 1.6 respectively. As contrasted with the United States which has a comparable fertility rate of 1.66 despite being much wealthier than all three of those countries combined. As such, though there is a moderate correlation, there is more likely to be other factors which lead to a higher GDP some of the time as well as the lower fertility rates.
It should be noted that this does not refute the hypothesis that rather than money in general it is the relative wealth within society. This can be tested through segmentation of the population of a specific nation, preferably a uniform nation, to see if there is a correlation. However, my gut tells me this is not true since the African nations with the highest fertility rate also have a high level of wealth inequality. Meanwhile, Japan with its GNI of only 0.647, the 15th lowest in the world, has a crippling low fertility rate of 1.381. As such, it does not seem likely that wealth inequality is a major contributor to fertility decline; however, more research could overturn this initial assumption.
Another factor advanced is that there is no adequate maternity leave and benefits for parents. This is often named as the reason when discussing the United States or Japan. However, Europe provides a refutation of this argument with the EU having a fertility rate of 1.46 with a range of 1.79 for France and a mere 1.08 for Malta despite famously being the most pro-labor region in the world. This is also a refutation against the notion that it’s wealth inequality considering multiple countries in the top 20 are within the EU such as Slovenia, Luxembourg, Malta, and Iceland, with Slovakia being in the top 10 with a fertility rate of 1.57 which is under the United States. None of these nations, despite having the best benefits for workers and parents in the world, have a fertility rate above replacement. It could very well be a contributor to higher birth rates than normal, as such, more research is needed. Though, we can reject the idea that merely adopting European policies in other nations is the silver bullet to solve the fertility crises.
This also leads to the preliminary rejection that monetary rewards for fertility are not the solution for increasing the fertility rate. We can see this in that the South Korean government has offered $14,000 as an incentive to even marry and it has had no effect on the marriage rate. Some companies such as the Booyoung Group, a construction firm, have offered its employees $75,000 upon the birth of each child. The previous $14,000 incentive program has as of the publishing of this article had no one accept it. I learned about this incentive program from an article from the Wall Street Journal. Sourced below from msn. The article blames toxic work culture; however, if so, then we would see similar programs work in the EU where the work culture isn't as toxic. However, free childcare and plenty of maternity leave have failed to materialize enough fertility. To argue for toxic work environment as a major contributing factor, as we shall see in the regression analysis below, the East Asian countries all present outliers having lower birth rates then would be predicted. As such, a toxic work environment, while not conclusively the issue, is statistically pointed to as a contributor unless there is another factor I am unaware of which is common to the East Asian nations.
I was browsing Twitter and saw someone whose name escapes me, and who I forgot to bookmark so I could give credit later, who proposed that it is the number of women in higher education. I was naturally incredulous as to this conclusion; however, one factor convinced me to give this hypothesis a further analysis. Iran has a low birth rate, and it has frustrated my thoughts on the matter since it is a religious state with a low GDP. However, it does have a nearly identical ratio of men to women within its university which tracks with the hypothesis. As such, I determined that a preliminary data analysis was required.
For this analysis I tested to see if there was a correlation between the ratio of men to women, with a lower number meaning more women, and the dropping of fertility rates. To this end, I first tested to see if there was a correlation between the number of men in higher education and the number of women in higher education by themselves yielding the following data.
| Correlation between fertility rate and female enrollment | -0.722688235 |
| Correlation between fertility rate and male enrollment | -0.661054695 |
As we can see, while the correlation between fertility rate and female enrollment is the highest, there is still a significant correlation with the male enrollment. Indeed, both are within each other's error. As such, this seems to prove the null hypothesis, dismissing the correlation as targeting women and instead being higher education in general. However, if we check the correlation between male and female enrollment, we see that there is a 0.917586838 correlation meaning that even if there was a correlation independent of the male enrollment, it would be drowned out by male enrollment growing at a slower but still correlated rate. As such, the only accurate way to test this hypothesis is through the ratio of male to female enrollment targeting specifically the difference. The flaw with this is that it necessarily erases if the true cause is higher education in and of itself or a third factor.
Testing the correlation, we arrive at a correlation of 0.710629762 which is slightly lower than the correlation between the fertility rate and purely female enrollment. This tells us that while controlling for total increase in school enrollment, there is still a correlation between female enrollment and the fertility rate. As such, we have failed to reject the null hypothesis and must consider the fact that an increase in female enrollment in relation to male enrollment may lead to a drop in the birth rates.
As such I ran a linear regression in Excel as shown here.
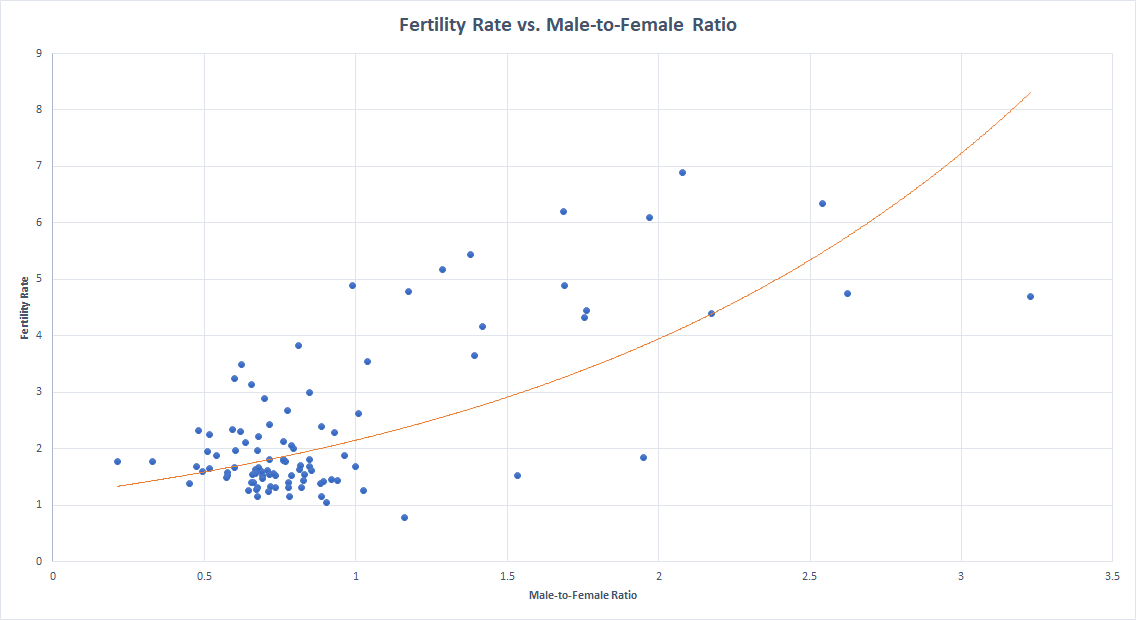
Both linear regressions provide roughly the same information, but in essence, the minimum residual is -2.47 with a max of 2.43. The median residual is -0.2079. This tells us that while the model is somewhat good with half of the residuals lying within -0.56 and 0.49, there are several outliers that as they have been enough to dismiss the earlier theories as such must be addressed if this theory is to hold water.
The first such outlier and indeed the most radical outlier is that while there is nearly twice as many men as women within higher education, North Korea still has a birth rate below replacement. This outlier can be safely dismissed since North Korea is an oppressive dictatorship and thus not relevant to other nations. The nation that is relevant however is the country of Liechtenstein which if not for its miniscule stature would prove a much more significant obstacle to the hypothesis that women within higher education is the primary factor for a lack of birth rates. Thus we can safely dismiss it due to its small size.
What we cannot dismiss however is the remaining three outliers: Iran, Japan, and South Korea. All three make up a significant population and are not so unusual as North Korea to dismiss with a similarly theocratic regime of Afghanistan having a fertility rate of nearly 5 correlating mostly near the regression line both straight and curved. South Korea and Japan on the other hand are liberal democracies. Here we can see a proof to those who argue that the toxic work environment within these countries lends to their low birth rates. Singapore nearing 1 fertility rate and the conspiracy theory that China has dropped below a billion population lends support to there being a cultural factor.
Lending its support to the significant cultural factor is Israel having the highest fertility rate within the Middle East only beaten by Syria which is less of an outlier as the male-to-female ratio is closer to 1. In addition, all of Africa is an outlier. With the nations having a fertility rate above 3, every single one but Afghanistan is within Sub-Saharan Africa. In most cases the nations outperform the predicted fertility rate. Interestingly enough only three countries that had a fertility rate above replacement were below the prediction: Afghanistan, Guinea, and South Sudan, which means of the countries above the prediction line and having a fertility rate of more than 3, every single country was in Sub-Saharan Africa and the vast majority have a higher fertility rate than predicted. Likewise, the majority of East Asia and Europe have fertility rates below prediction. This means that there are additional factors that stifle birth rates in some places and boost birth rates within Sub-Saharan Africa, especially the Sahel. This factor also fails to boost birth rates in the Middle East. With the exception of Israel and Syria, they either track the prediction well or have a suppressed fertility rate.
From this we can say that while these results are interesting, to say the least, and should be kept in mind as a factor worthy of additional investigation, this is not the silver bullet to solving the birth rates. In addition, while it could be a cause, it could just as well be a symptom of the mutual cause of the fertility rate drop. More study is required to test if there is any mutual cause. The regression seems to suggest that all countries besides Korea and Liechtenstein could by capping the number of women in higher education to 30% solve their birth rates. However, because of the discussed reasons and outliers, I would hesitate to attempt such a drastic measure and by no means suggest that this should be taken as a serious policy proposal.
What we can conclude is that either one of the factors or a symptom of one of the factors of the collapsing fertility rates is the ratio between men and women within higher education. As such while we have failed to refute the claim that this is the factor, we have at the same time failed to confirm it meaning that it is unlikely to be the case. More research is required to further investigate this theory.
Another theory that I might investigate is that of religiosity being the primary factor. This seems probable as my gut is informing me that the more religious a population is the less likely women are to go to higher education since they are not expected to become breadwinners, but rather housewives. I, however, have no statistics as of the writing of this article to prove this one way or another. If I continue this line of research, it is in this direction that I will take it.
Bibliography
Yoon, Dasl. "Even a $14,000 Government Handout Can't Get South Korea's Singles to Marry." MSN, 27 Mar. 2025, www.msn.com/en-us/news/world/even-a-14000-government-handout-can-t-get-south-korea-s-singles-to-marry/ar-AA1BJV21?ocid=BingNewsSerp. Accessed 3 Apr. 2025.
Tas, Ozgur Cem. World GDP (GDP, GDP per capita, and annual growths). Kaggle, 19 Mar. 2022, https://www.kaggle.com/datasets/zgrcemta/world-gdpgdp-gdp-per-capita-and-annual-growths. Accessed 3 Apr. 2025.
World Bank. "Fertility Rate, Total (Births per Woman)." World Bank Open Data, World Bank, data.worldbank.org/indicator/SP.DYN.TFRT.IN. Accessed 3 Apr. 2025.
World Bank. "School Enrollment, Tertiary (% Gross)." World Bank Open Data, World Bank, data.worldbank.org/indicator/SE.TER.ENRR. Accessed 3 Apr. 2025.